Features · IoT Condition Monitoring
Hear the failure coming — weeks early
Vibration, temperature and current telemetry stream into Reliabilytics. Threshold breaches raise predictive alerts and severe ones open work orders automatically.
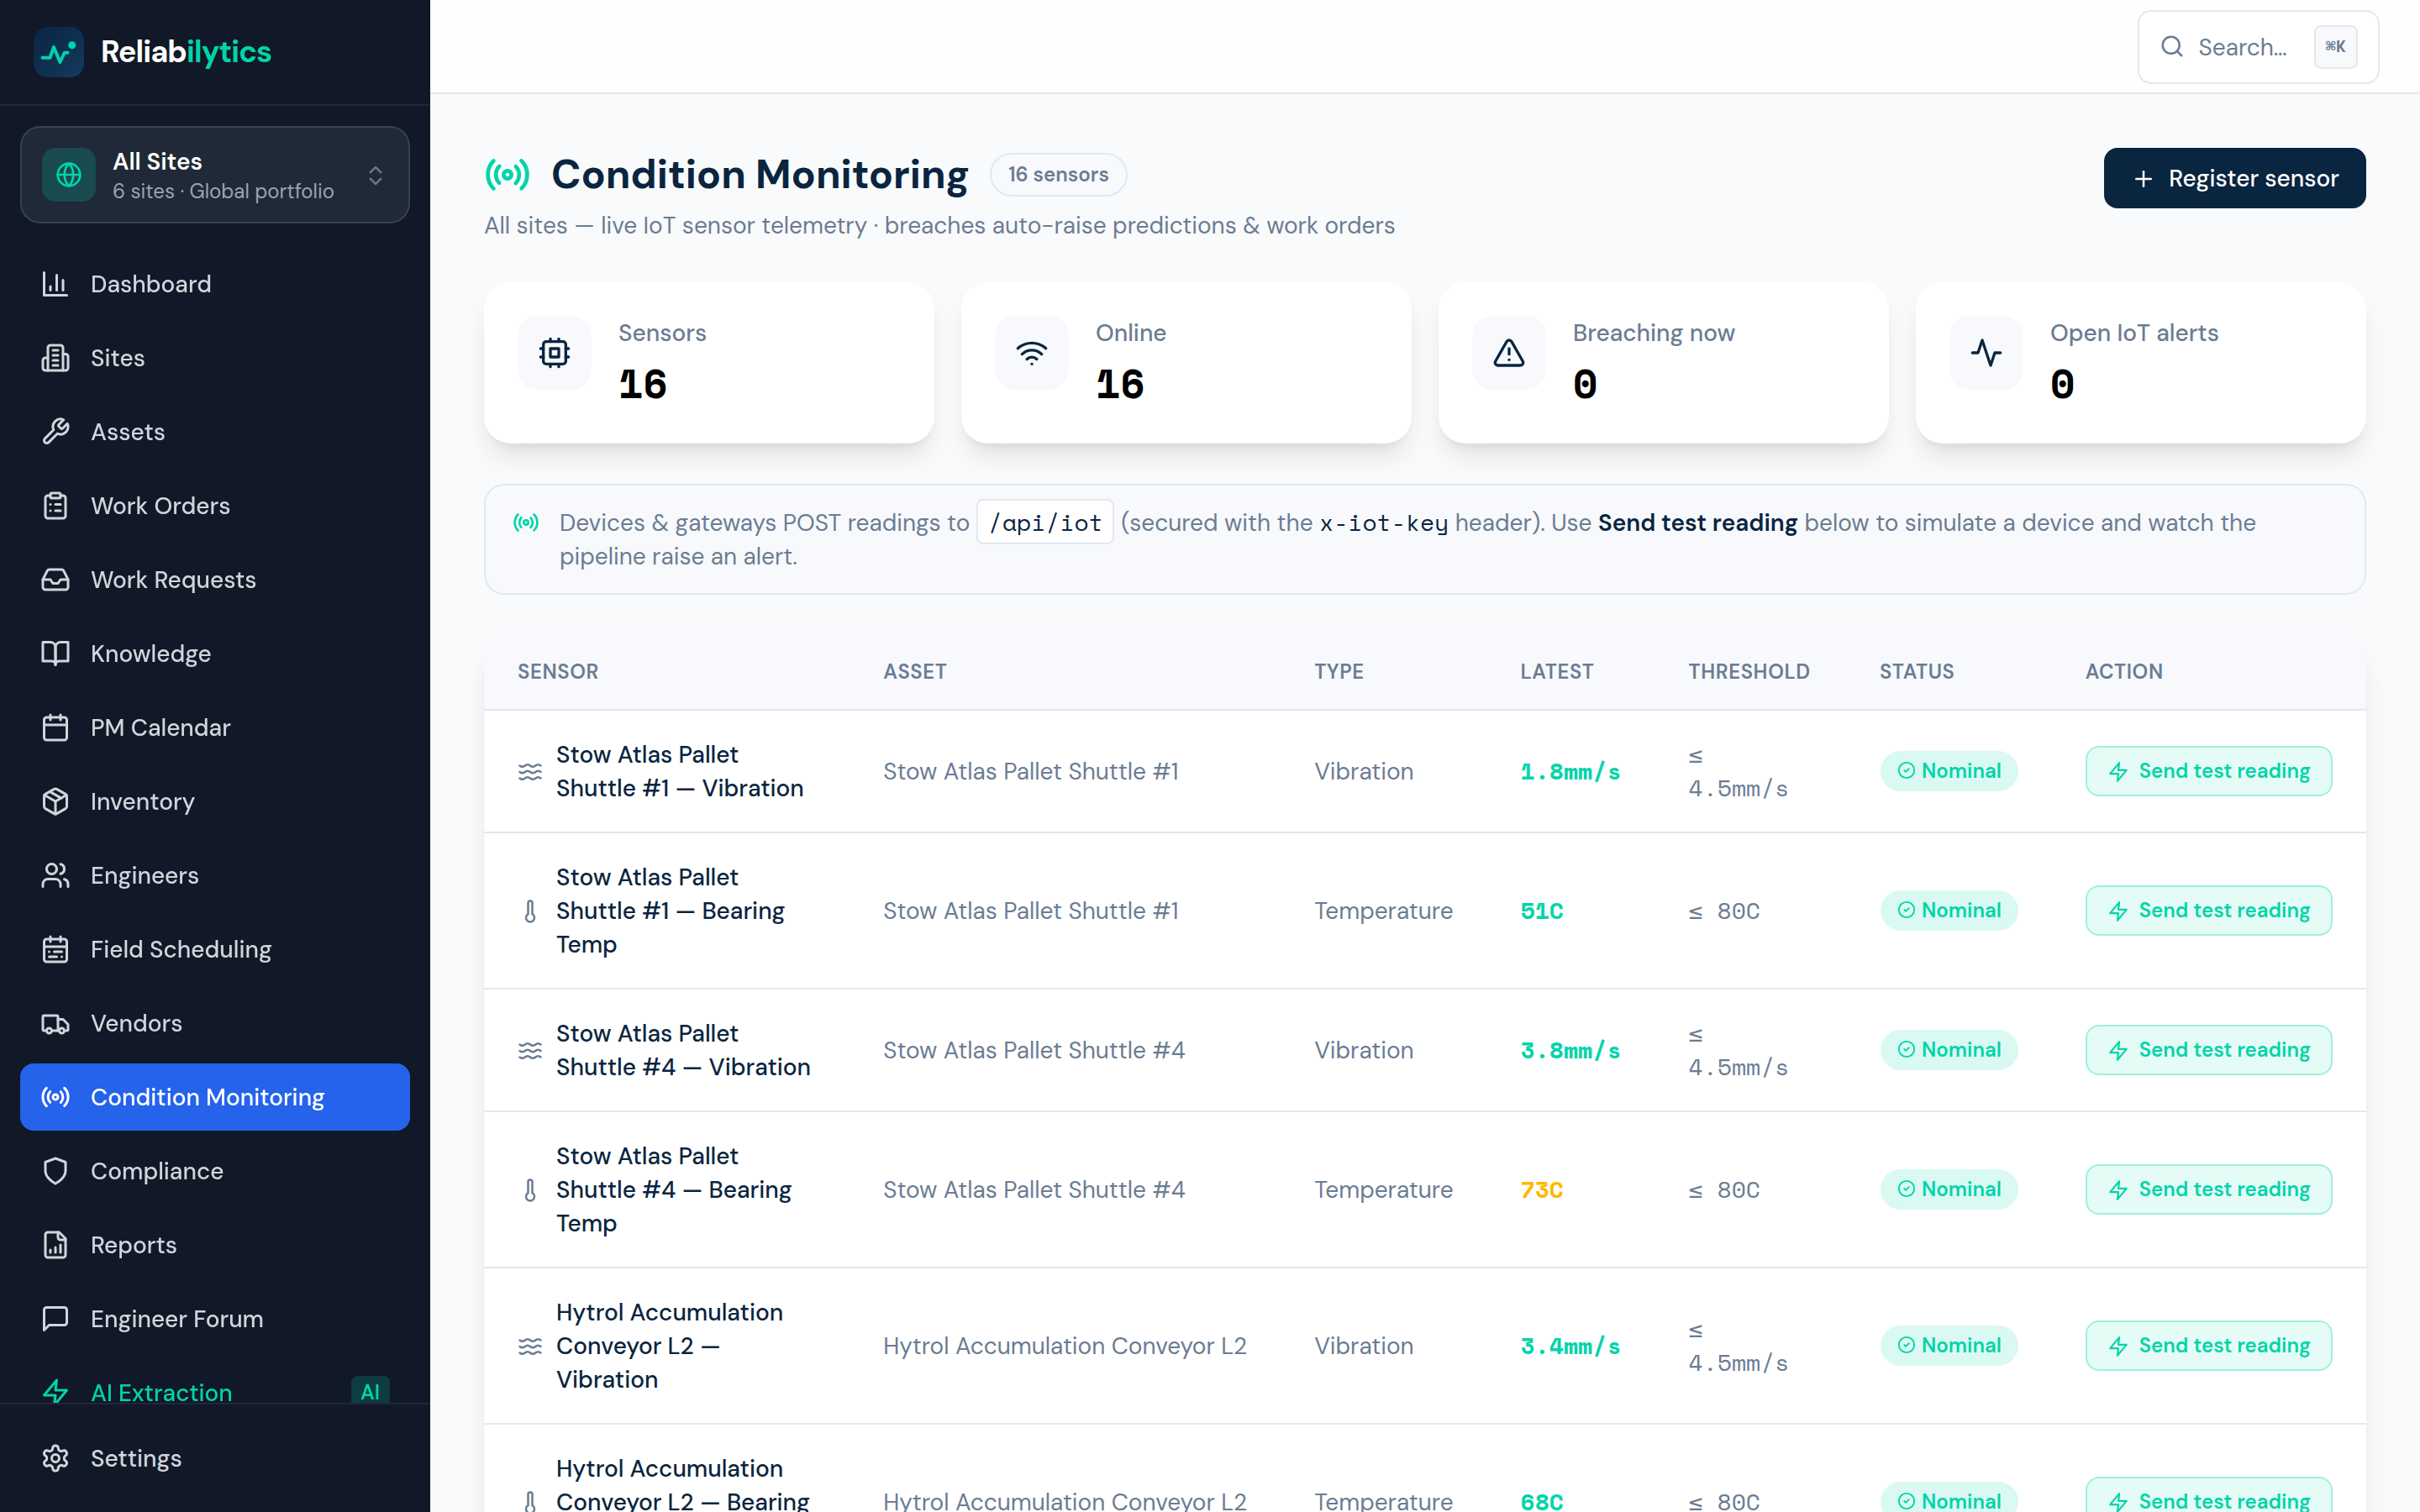
Real product screenshot — this is the screen you get, not a mock-up.
How it works, step by step
Exactly what happens, in the order it happens.
- 1
Connect sensors — or the data you already have
Bolt-on vibration and temperature sensors from ~£45, or stream telemetry your PLCs, drives and SCADA already produce. Everything posts to one secure ingestion endpoint.
- 2
Readings checked against thresholds live
Every reading is stored and compared to per-device limits (or sensible engineering defaults — e.g. 4.5 mm/s vibration). Status is visible per sensor: nominal or breaching.
- 3
Breaches become predictions
A threshold breach raises an AI prediction against the asset with confidence and time-to-failure — de-duplicated so a noisy sensor never floods the queue.
- 4
Severe breaches open work orders themselves
Readings far over threshold auto-create a Predictive work order, prioritised by asset criticality — the fix is scheduled before the failure is felt.
What it changes for your business
Catch failures in the planned window
Bearing wear found by a sensor is a scheduled hour; found by a breakdown it's an unplanned shift.
No separate PdM platform
Condition data lives in the same system as the work it creates — one login, one asset register, one history.
Start at pilot cost
A five-point starter deployment costs about the same as one avoided call-out.
Use iot condition monitoring today
Get started with Standard, or open the live demo — no signup required.