Features · Custom Dashboards
A command centre arranged the way you run
Thirteen live widgets — KPIs, charts, work-order lists, AI insights, compliance score — that every user pins, reorders and removes to build their own dashboard, saved to their account.
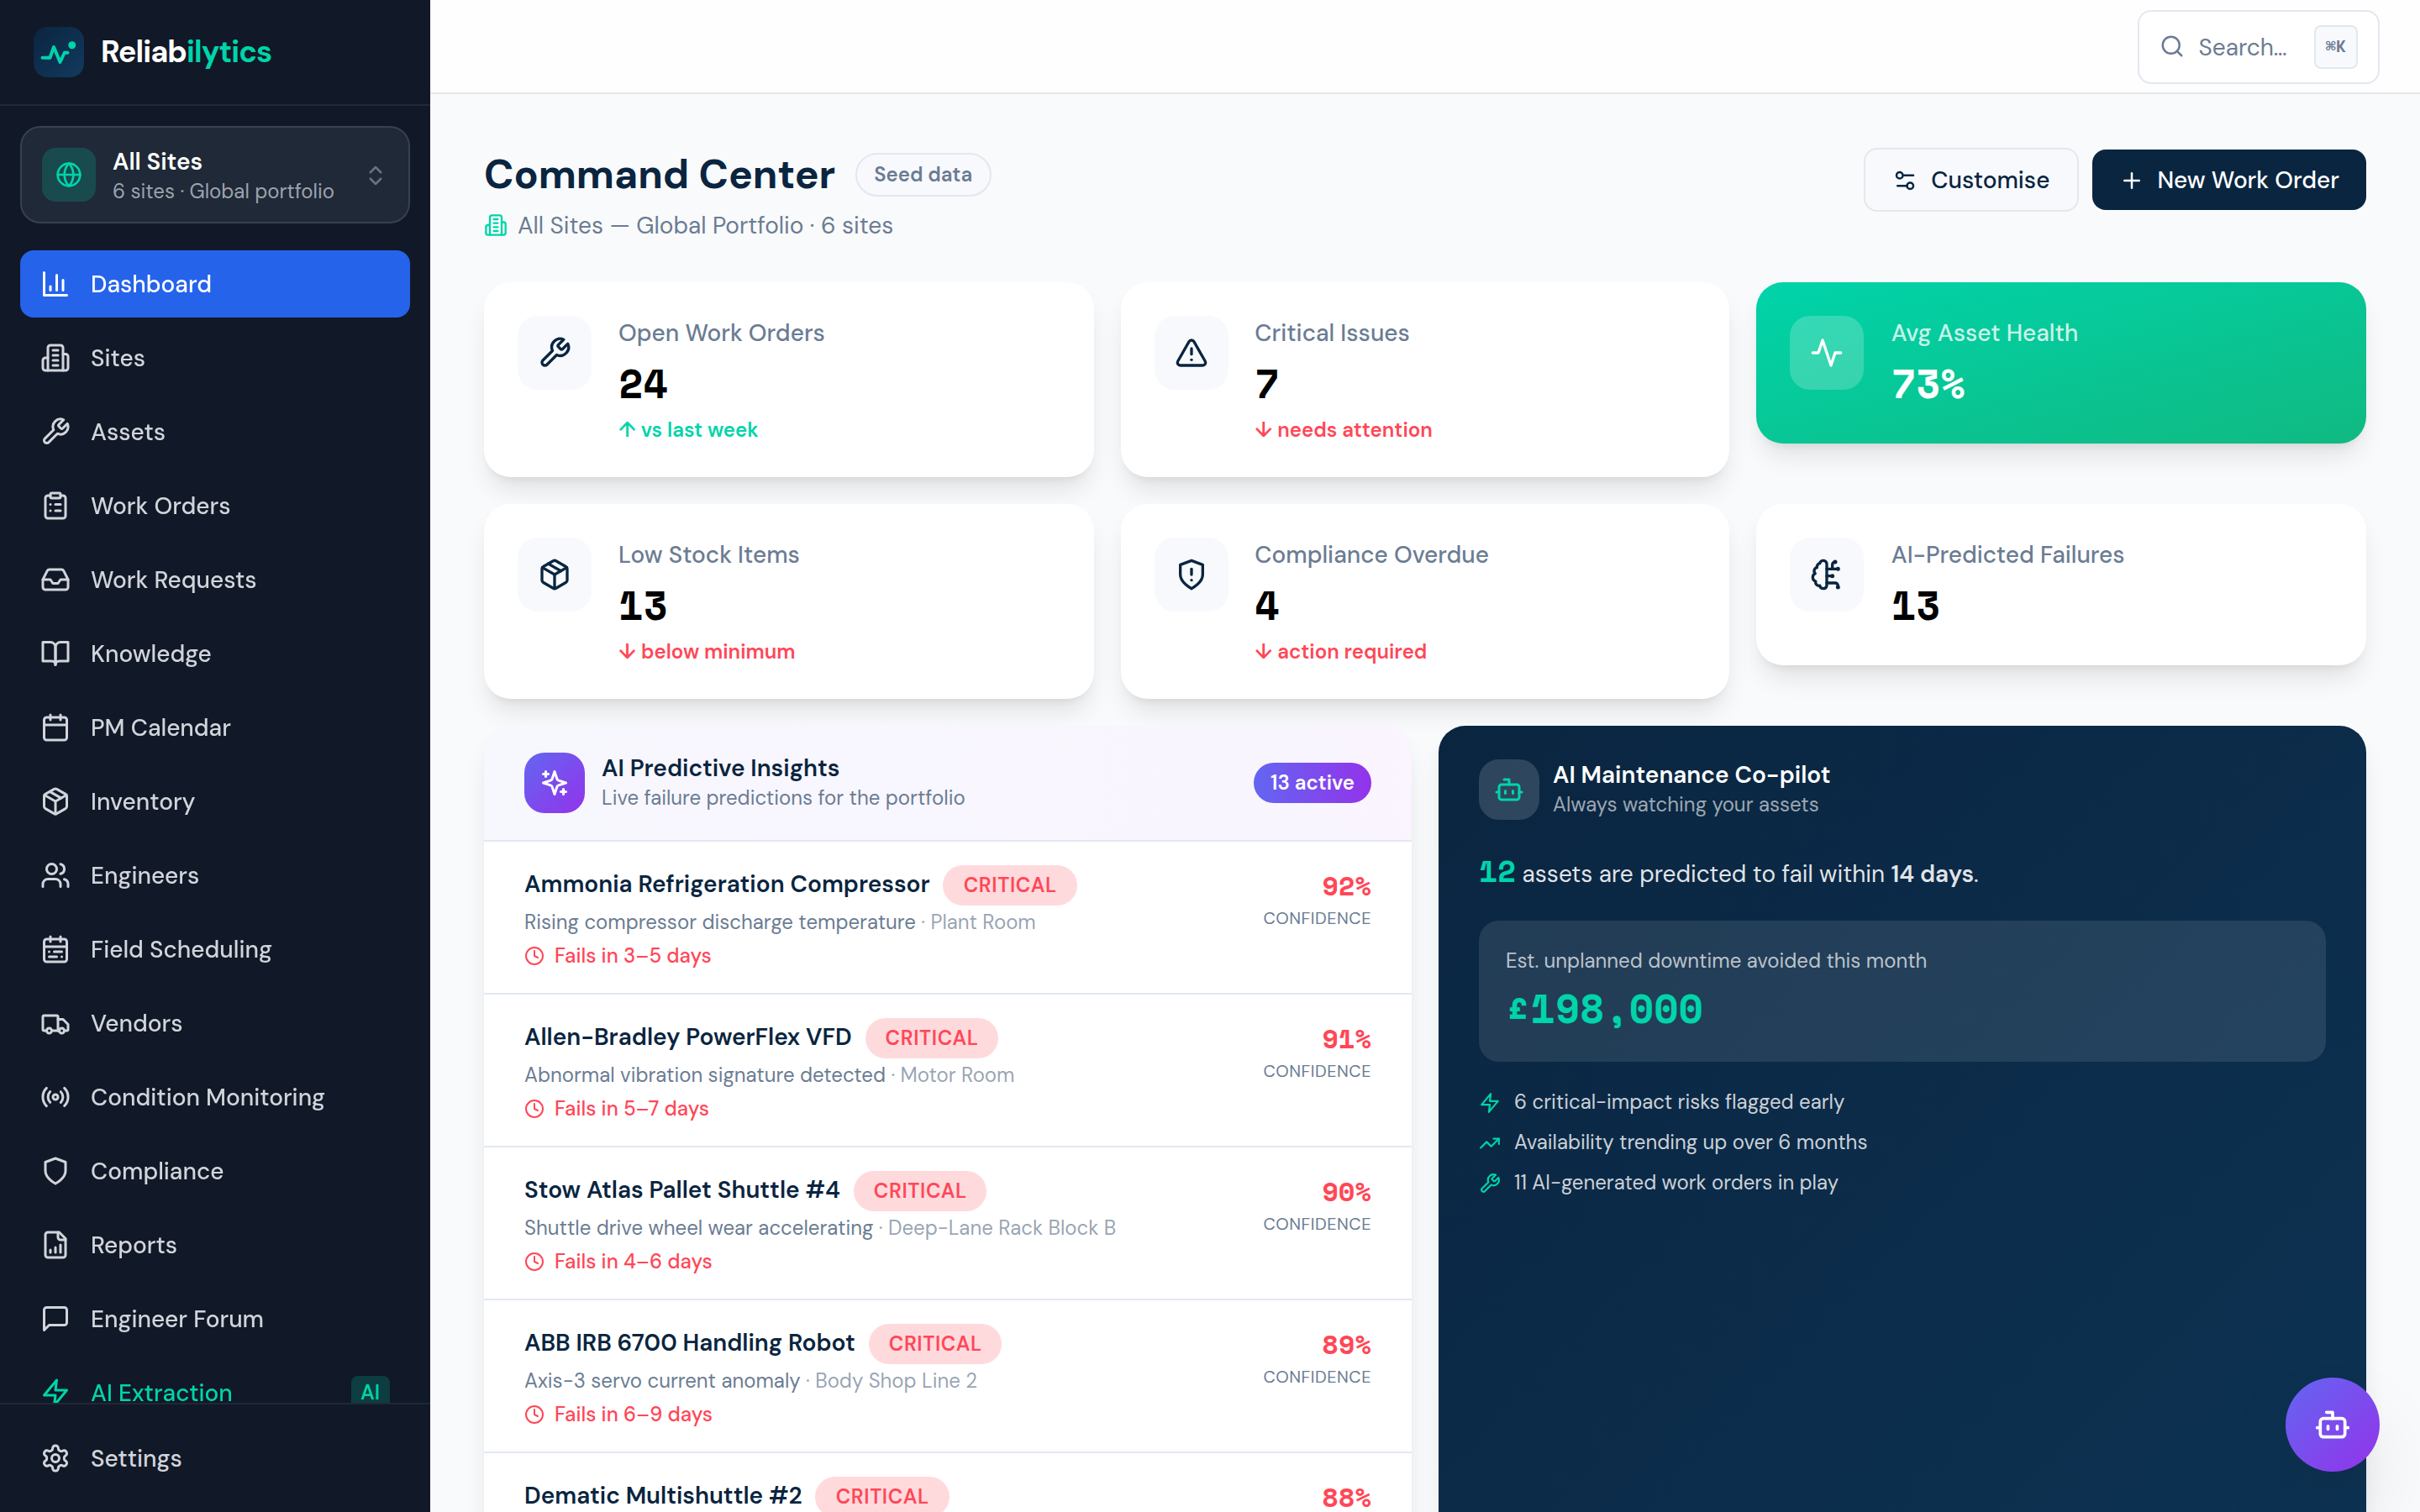
Real product screenshot — this is the screen you get, not a mock-up.
How it works, step by step
Exactly what happens, in the order it happens.
- 1
Start from a sensible default
Every user begins with the classic command centre: KPI tiles, AI predictive insights, availability trend, open work orders, lowest asset health and the compliance ring.
- 2
Hit Customise and make it yours
Drag widgets into a new order (or use the arrow buttons), remove what you don't use, and add from the catalog — each entry shows what it does before you pin it.
- 3
Widgets are live, not screenshots
Every tile loads real data for your active site: work orders, health scores, sensor-driven predictions, compliance status — the same numbers as the full pages behind them.
- 4
Your layout follows your login
Boards persist per user to the database (with a local fallback), so the layout you built is the layout you get on every device. One click resets to default.
What it changes for your business
The morning glance, personalised
A stores manager pins inventory and compliance; a reliability engineer pins AI insights and availability. Same platform, each role's own front page.
No dashboard sprawl
Widgets come from a governed catalog computing from live data — no orphaned copies of stale charts.
Zero setup cost
The default board is the classic command centre, so nobody has to build anything to get value on day one.
Use custom dashboards today
Get started with Standard, or open the live demo — no signup required.